
Marketing with Machine Learning: Apriori
Want to share your content on R-bloggers? click here if you have a blog, or here if you don't.
This is part 1 of an ongoing series, introduced in Detroit Data Lab Presents: Marketing with Machine Learning
Introduction
Apriori, from the latin “a priori” means “from the earlier.” As with many of our predictions, we’re learning from the past and applying it toward the future.
It’s the “Hello World” of marketing with machine learning! The simple application is growth in sales by identifying items that are commonly purchased together as part of a set by a customer, segment, or market. Talented marketers can power a variety of strategies with insights from this, including intelligent inventory management, market entry strategies, synergy identification in mergers & acquisitions, and much more.
The Marketing with Machine Learning Starter Kit: A problem, a data specification, a model, and sample code.
First, the problem we’re solving. We all understand Amazon’s “customers like you also purchased…” so let’s branch out. In the example at the bottom, we’re looking to help shape our market strategy around a key client. This tactic would be particularly useful as part of an account-based marketing strategy, where a single client is thought of as a “market of one” for independent analysis.
We’ll pretend your business has gone to great lengths to understand where one of your customers sources all of its materials, and mapped it out accordingly. You want to understand your opportunity for expansion. If this customer purchases services X from other customers, are there other strongly correlated services? You could be missing out on an opportunity to land more business, simply by not knowing enough to ask.
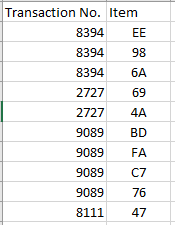
We move on to the data specification. There are two best ways to receive this data. The long dataset, or “single” dataset, looks like this:
The wide dataset, or the “basket” dataset, looks like this:

CSV’s, as usual, are the typical way these are transferred. Direct access to a database or system is always preferred, since we want to tap into pre-existing data pipelines where necessary so it’s already cleaned and scrubbed of any sensitive information.
Next, the model to use. In this case, we’re interested in determining the strength of association between purchasing service X and any other services, so we’ve selected the apriori algorithm. The apriori algorithm has 3 key terms that provide an understanding of what’s going on: support, confidence, and lift.
Support is the count of how often items appear together. For example, if there are 3 purchases:
- Pen, paper, keyboard
- Computer, soda, pen
- Pen, marker, TV, paper
Then we say the support for pen + paper is 2, since the group occurred two times.
Confidence is essentially a measure of how much we believe product will follow, once we know product X is being purchased. In the example above, we would say that buying pen => buying paper has confidence of 66.7%, since there are 3 transactions with a pen, and 2 of them also include paper.
Lift is the trickiest one. It’s the ratio of your confidence value to your expected confidence value. It often is considered the importance of a rule. Our lift value for the example above is (2/3) / ((3/3) * (2/3)) or 1. A lift value of 1 is actually uneventful or boring, since what it tells us is that the pen is very popular, and therefore the paper purchase probably has nothing to do with the pen being in the transaction. A lift value of greater than 1 implies some significance in the two items, and warrants further investigation.
Finally, the code you can use. To keep the introduction simple, we’re using R with only a few packages, and nothing more sophisticated than a simple CSV.
Using the Detroit Business Certification Register from the City of Detroit, we’ll interpret it as a consumption map. This dataset, with its NIGP Codes, provides us with a transactional set of all categories a business is in.
## Apriori Demonstration code

# Loading appropriate packages before analysis
library(tidyr)
library(dplyr)
library(stringr)
library(arules)

# Read in the entire Detroit Business Register CSV
dfDetBusiness <- read.csv("Detroit_Business_Certification_Register.csv")

# Prepare a new data frame that puts each NIGP code in its own row, by business
dfCodes <- dfDetBusiness %>%
    mutate(Codes = strsplit(as.character(NIGP.Codes),",")) %>%
    unnest(Codes) %>%
    select(Business.Name, Codes)

# Some rows appear with a decimal place. Strip out the decimal place.
dfCodes$Codes <- str_remove(dfCodes$Codes, "\\.0")

# Also trim the whitespace from any codes if it exists
dfCodes$Codes <- trimws(dfCodes$Codes)

# Write the data
write.csv(dfCodes, file = "TransactionsAll.csv", row.names = FALSE)

# Import as single with arule
objTransactions <- read.transactions("TransactionsAll.csv", format = "single", skip = 1, cols = c(1,2))

# Glance at the summary; does it make sense?
summary(objTransactions)

# Relative frequency of top 10 items across all transactions
itemFrequencyPlot(objTransactions,topN=10,type="relative")

# Generate the association rules; maximum 4 items in a rule
assoc.rules <- apriori(objTransactions, parameter = list(supp=0.001, conf=0.8,maxlen=4))

# Check out the summary of the object
summary(assoc.rules)

# View the top 25 rules
inspect(assoc.rules[1:25])
By plotting the frequency, reviewing the summary of the association rules, and inspecting a few of the rows, a plan can begin to emerge on what actions to take.
In this case, we find Rental Equipment (977) and Amusement & Decorations (037) always go together. Similarly, when Acoustical Tile (010) and Roofing Materials (077) are purchased, so are Elevators & Escalators (295). An odd combination!
Conclusion
With these insights uncovered, a marketer can begin to form a strategy. Do you develop a new product? Exit a specific market? Press on the customer to purchase more in a certain area from us, or a strategic partner? The possibilities are endless, but at least you’re armed with knowledge to make the decision!
R-bloggers.com offers daily e-mail updates about R news and tutorials about learning R and many other topics. Click here if you're looking to post or find an R/data-science job.
Want to share your content on R-bloggers? click here if you have a blog, or here if you don't.