
Checking Historical Precipitation Data Quality
Want to share your content on R-bloggers? click here if you have a blog, or here if you don't.
Precipitation Data Quality Concerns
I am interested in evaluating potential changes in precipitation patterns caused by climate change. I have been working with daily precipitation data for the Philadelphia International Airport, site id KPHL, for the period 1950 to present time using R.
I originally used the Pennsylvania State Climatologist web site to download a CSV file of daily precipitation data from 1950 to the present. After some fits and starts analyzing this data set, I discovered that data for January was missing for the period 1950 – 1969. This data gap seriously limited the usable time record.
John Yagecic, (Adventures In Data) told me about the weatherData package which provides easy to use functions to retrieve Weather Underground data. I have found several precipitation data quality issues that may be of interest to other investigators.
I used a 2-step process to automate downloading and quality assurance of 66 years of daily precipitation data:
- Download: 66 annual csv files with date and precipitation – inches for each day in year
- Data Quality scan:
- Produce single pdf with 66 color coded check plots, one for each year, showing all precipitation data, allowing user to visually scan plots
- Identify questionable data years by tagging years with high daily precipitation values.
The precipitation data download R script:
library(weatherData)
library(lubridate)
# station_id KPHL
# Used: showAvailableColumns(station_id = "KPHL", ## start_date = "1950-01-01") to find column number for precip data
## weatherData only seems to bring back 400 +- records.
## Need to loop through individual years to get full historical record
for (yr in 1950:2015) {
 start <- paste(yr,"-01-01",sep="")
 end <- paste(yr,"-12-31",sep="")
 precip_yr <- paste("precip_",yr, sep="")
 yr_data <- getWeatherForDate("KPHL", start_date=start, ,end_date=end, opt_custom_columns=T, custom_columns=c(20))
 yr_data$Date <- ymd(yr_data$Date)
# make csv file name for each year of data downloaded
 my_dir <- "enter destination directory"
 link <- paste(my_dir,precip_yr,".csv",sep="")
  write.csv(yr_data, link, quote=FALSE, row.names = F) }
The precipitation data quality R script:
csv_file_dir <- "enter directory with source annual csv files"

# Use pdf to route all annual plots to single pdf for easy data review
  pdf_out <- "enter output pdf file directory and name here"
  pdf(pdf_out)

## Get list of files from directory
 filenames=list.files(path=csv_file_dir, full.names=TRUE)

## There are 66 annual files for 1950 - 2015
## Read and plot each file so that visual scan can be applied to annual data csv
   quest_yrs <- numeric()    # vector for questionable years based on high values
   quest_max <- numeric()    # vector of max value in questionable year

# set basic plot pars
   par(mar=c(3,5,3,1)); par(las=1)
 for (yr in 1:66){
   quest_yr_count <- 0
   ann_yr <- 1949 + yr
   ann_df <- read.table(filenames[yr],header=T,as.is=T, sep=",")
   ann_df$Date <- ymd(ann_df$Date)
   ann_df$PrecipitationIn <- as.numeric(ann_df$PrecipitationIn)
   max_precip <- max(ann_df$PrecipitationIn,na.rm=T) # generate vectors for questionable years and max precip values if (max_precip >10) {
    quest_yrs <- c(quest_yrs,ann_yr)
    quest_max <- c(quest_max,max_precip)
      }
# plot each year for visual review
   title_col <- ifelse(max_precip>10,"red","black" )
   title <- paste("KPHL Annual Precip Data QA Plot\n", ann_yr, sep="")
   st_date <- ann_df$Date[1]
   num <- nrow(ann_df)
   end_date <- ann_df$Date[num]
   plot(ann_df$Date, ann_df$PrecipitationIn, main = title, col.main=title_col,
  col=title_col,xlim=c(st_date,end_date), ylab="Daily Precip - Inches")
   }
dev.off()
qa_sum <- data.frame(quest_yrs, quest_max)
qa_sum
The qa_sum data.frame shows 9 years with questionable max precipitation values:
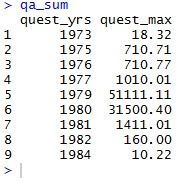
This plot shows the 1979 data, color coded, to reflect that it is a questionable year.

The 51,111 inch daily rainfall value clearly sticks out.
I used the getWeatherData function to retrieve the Sept. 8, 1979 precipitation data to make sure that it was a source data issue and not a processing issue.
getWeatherForDate("KPHL", "1979-09-08", opt_custom_columns=T, custom_col=20)

# [1] "Date" "PrecipitationIn"
# Date PrecipitationIn
# 1 1979-09-08 51111.11
This confirms that the source data file data is questionable.
While these data errors may be typographical, they must be corrected prior to proceeding with any analysis of KPHL precipitation data.

R-bloggers.com offers daily e-mail updates about R news and tutorials about learning R and many other topics. Click here if you're looking to post or find an R/data-science job.
Want to share your content on R-bloggers? click here if you have a blog, or here if you don't.