Autoregressive Conditional Poisson Model – I
[This article was first published on Yet Another Blog in Statistical Computing » S+/R, and kindly contributed to R-bloggers]. (You can report issue about the content on this page here)
Want to share your content on R-bloggers? click here if you have a blog, or here if you don't.
Want to share your content on R-bloggers? click here if you have a blog, or here if you don't.
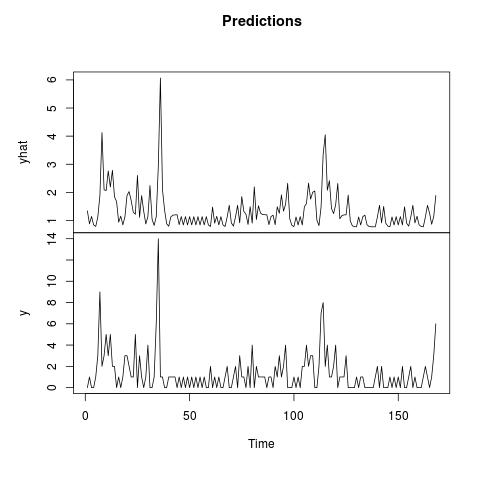
Modeling the time series of count outcome is of interest in the operational risk while forecasting the frequency of losses. Below is an example showing how to estimate a simple ACP(1, 1) model, e.g. Autoregressive Conditional Poisson, without covariates with ACP package.
library(acp)

### acp(1, 1) without covariates ###
mdl <- acp(y ~ -1, data = cnt)
summary(mdl)
# acp.formula(formula = y ~ -1, data = cnt)
#
#   Estimate   StdErr t.value   p.value
# a 0.632670 0.169027  3.7430 0.0002507 ***
# b 0.349642 0.067414  5.1865 6.213e-07 ***
# c 0.184509 0.134154  1.3753 0.1708881

### generate predictions ###
f <- predict(mdl)
pred <- data.frame(yhat = f, cnt)
tail(pred, 5)
#          yhat y
# 164 1.5396921 1
# 165 1.2663993 0
# 166 0.8663321 1
# 167 1.1421586 3
# 168 1.8923355 6

### calculate predictions manually ###
pv167 <- mdl$coef[1] + mdl$coef[2] * pred$y[166] + mdl$coef[3] * pred$yhat[166]
# [1] 1.142159

pv168 <- mdl$coef[1] + mdl$coef[2] * pred$y[167] + mdl$coef[3] * pred$yhat[167]
# [1] 1.892336

plot.ts(pred, main = "Predictions")
To leave a comment for the author, please follow the link and comment on their blog: Yet Another Blog in Statistical Computing » S+/R.
R-bloggers.com offers daily e-mail updates about R news and tutorials about learning R and many other topics. Click here if you're looking to post or find an R/data-science job.
Want to share your content on R-bloggers? click here if you have a blog, or here if you don't.

