Articles by Alexej's blog

Probabilistic interpretation of AUC

January 25, 2018 | Alexej's blog

Unfortunately this was not taught in any of my statistics or data analysis classes at university (wtf it so needs to be :scream_cat:). So it took me some time until I learned that the AUC has a nice probabilistic meaning. What’s AUC anyway? AUC is the area under ... [Read more...]

Probabilistic interpretation of AUC

January 24, 2018 | Alexej's blog

Unfortunately this was not taught in any of my statistics or data analysis classes at university (wtf it so needs to be :scream_cat:). So it took me some until I learned that the AUC has a nice probabilistic meaning. What’s AUC anyway? Consider: A dataset : , where is a ... [Read more...]

Freedman’s paradox

June 5, 2017 | Alexej's blog

Recently I came across the classical 1983 paper A note on screening regression equations by David Freedman. Freedman shows in an impressive way the dangers of data reuse in statistical analyses. The potentially dangerous scenarios include those where t...
[Read more...]

Freedman’s paradox

June 5, 2017 | Alexej's blog

Recently I came across the classical 1983 paper A note on screening regression equations by David Freedman. Freedman shows in an impressive way the dangers of data reuse in statistical analyses. The potentially dangerous scenarios include those where t... [Read more...]

5 ways to measure running time of R code

May 27, 2017 | Alexej's blog

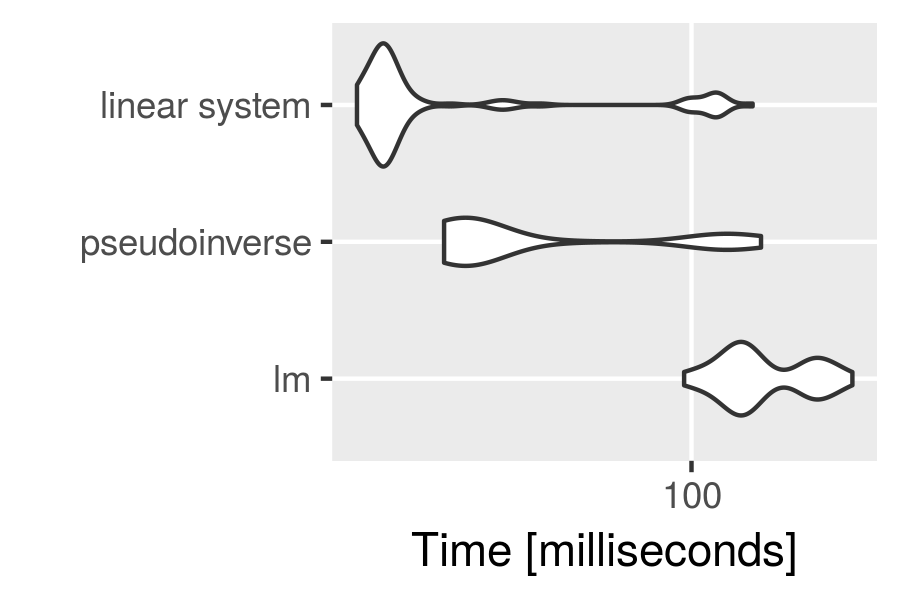
A reviewer asked me to report detailed running times for all (so many :scream:) performed computations in one of my papers, and so I spent a Saturday morning figuring out my favorite way to benchmark R code. This is a quick summary of the options I fou...
[Read more...]

5 ways to measure running time of R code

May 27, 2017 | Alexej's blog

A reviewer asked me to report detailed running times for all (so many :scream:) performed computations in one of my papers, and so I spent a Saturday morning figuring out my favorite way to benchmark R code. This is a quick summary of the options I found to be available. ... [Read more...]

Contours of statistical penalty functions as GIF images

March 17, 2017 | Alexej's blog

Many statistical modeling problems reduce to a minimization problem of the general form: or where $f$ is some type of loss function, $\mathbf{X}$ denotes the data, and $g$ is a penalty, also referred to by other names, such as “regularization term” (problems (1) and (2-3) are often equivalent by the ... [Read more...]

Contours of statistical penalty functions as GIF images

March 17, 2017 | Alexej's blog

Many statistical modeling problems reduce to a minimization problem of the general form: or where is some type of loss function, denotes the data, and is a penalty, also referred to by other names, such as “regularization term” (problems (1) and (2-3) are often equivalent by the way). Of course both, ... [Read more...]

Visualization of MRI data in R

January 27, 2017 | Alexej's blog

Lately I was getting a little bored with genomic data (and then TCGA2STAT started to give me a segfault on my university’s high performance computing facility too :stuck_out_tongue:). So I decided to analyze some brain imaging data that I had lying a... [Read more...]
1 2

Never miss an update!
Subscribe to R-bloggers to receive
e-mails with the latest R posts.
(You will not see this message again.)

Click here to close (This popup will not appear again)