
An update to the nhmrcData R package
[This article was first published on R – What You're Doing Is Rather Desperate, and kindly contributed to R-bloggers]. (You can report issue about the content on this page here)
Want to share your content on R-bloggers? click here if you have a blog, or here if you don't.
Want to share your content on R-bloggers? click here if you have a blog, or here if you don't.
 Just pushed an updated version of my nhmrcData R package to Github. A quick summary of the changes:
- In response to feedback, added the packages required for vignette building as dependencies (Imports) – commit
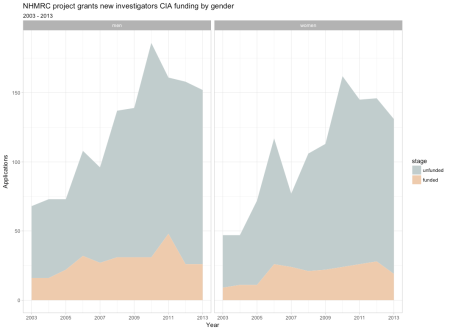
- Added 8 new datasets with funding outcomes by gender for 2003 – 2013, created from a spreadsheet that I missed first time around – commit and see the README
Vignette is not yet updated with new examples.
So now you can generate even more depressing charts of funding rates for even more years, such as the one featured on the right (click for full-size).
Enjoy and as ever, let me know if there are any issues.
Filed under: R, statistics Tagged: data, nhmrc, package, rstats

To leave a comment for the author, please follow the link and comment on their blog: R – What You're Doing Is Rather Desperate.
R-bloggers.com offers daily e-mail updates about R news and tutorials about learning R and many other topics. Click here if you're looking to post or find an R/data-science job.
Want to share your content on R-bloggers? click here if you have a blog, or here if you don't.