
an ABC experiment
Want to share your content on R-bloggers? click here if you have a blog, or here if you don't.
 In a cross-validated forum exchange, I used the code below to illustrate the working of an ABC algorithm:
#normal data with 100 observations
n=100
x=rnorm(n)
#observed summaries
sumx=c(median(x),mad(x))

#normal x gamma prior
priori=function(N){
 return(cbind(rnorm(N,sd=10),
  1/sqrt(rgamma(N,shape=2,scale=5))))
}

ABC=function(N,alpha=.05){

  prior=priori(N) #reference table

  #pseudo-data
  summ=matrix(0,N,2)
  for (i in 1:N){
   xi=rnorm(n)*prior[i,2]+prior[i,1]
   summ[i,]=c(median(xi),mad(xi)) #summaries
   }

  #normalisation factor for the distance
  mads=c(mad(summ[,1]),mad(summ[,2]))
  #distance
  dist=(abs(sumx[1]-summ[,1])/mads[1])+
   (abs(sumx[2]-summ[,2])/mads[2])
  #selection
  posterior=prior[dist<quantile(dist,alpha),]}
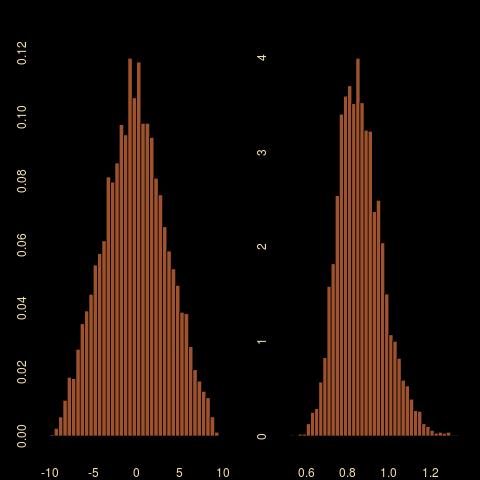
Hence I used the median and the mad as my summary statistics. And the outcome is rather surprising, for two reasons: the first one is that the posterior on the mean μ is much wider than when using the mean and the variance as summary statistics. This is not completely surprising in that the latter are sufficient, while the former are not. Still, the (-10,10) range on the mean is way larger… The second reason for surprise is that the true posterior distribution cannot be derived since the joint density of med and mad is unavailable.
 sample of size 5000: (top) ABC using mean and variance as summaries; (middle) ABC using median and mad as summaries; (bottom) Gibbs sampling, all based on 10⁶ simulations with the same 5% subsampling rate") After thinking about this for a while, I went back to my workbench to check the difference with using mean and variance. To my greater surprise, I found hardly any difference! Using the almost exact ABC with 10⁶ simulations and a 5% subsampling rate returns exactly the same outcome. (The first row above is for the sufficient statistics (mean,standard deviation) while the second row is for the (median,mad) pair.) Playing with the distance does not help. The genuine posterior output is quite different, as exposed on the last row of the above, using a basic Gibbs sampler since the posterior is not truly conjugate.
After thinking about this for a while, I went back to my workbench to check the difference with using mean and variance. To my greater surprise, I found hardly any difference! Using the almost exact ABC with 10⁶ simulations and a 5% subsampling rate returns exactly the same outcome. (The first row above is for the sufficient statistics (mean,standard deviation) while the second row is for the (median,mad) pair.) Playing with the distance does not help. The genuine posterior output is quite different, as exposed on the last row of the above, using a basic Gibbs sampler since the posterior is not truly conjugate.
Filed under: Books, pictures, R, Statistics, University life Tagged: ABC, Gibbs sampling, MCMC, mean, median, median absolute deviation, Monte Carlo Statistical Methods, normal model, summary statistics

R-bloggers.com offers daily e-mail updates about R news and tutorials about learning R and many other topics. Click here if you're looking to post or find an R/data-science job.
Want to share your content on R-bloggers? click here if you have a blog, or here if you don't.