December 2019
Dashboard
This dashboard presents open data (iNaturalist and BioScan) from Prudic, K.L.; Oliver, J.C.; Brown, B.V.; Long, E.C. Comparisons of Citizen Science Data-Gathering Approaches to Evaluate Urban Butte... [Read more...]
Data is present: Workshops and datathons
Enhanced data presentation using reproducible documents and dashboards
Calendar
Date
Title
Event and location
Registration
26 Nov 2020
Mixed-effects models in R, and a new tool for data simulation
New Tricks Seminars, Dept. Psychology, Lancaster University [online]
8 Oct 2020
Reproducibilidad en torno a una aplicación web
Reprohack en español, LatinR Conference 2020 [... [Read more...]
FOSS for Spectroscopy
For this inaugural blog post, I’m pleased to share a project I have been working on recently: FOSS4Spectroscopy is an attempt to catalog FOSS spectroscopy software. The page is designed to be updated easily with new or edited entries – see the ... [Read more...]
Boss of all plots – Box plots
I totally love boxplots, so much so that I may be even guilty of overusing it sometimes (if there is such a thing). Using just averages or percentile values is simplistic but they take away so much in terms of information. Histograms or Density plots work fine for showing individual ...

Predicting the next decade in the stock market
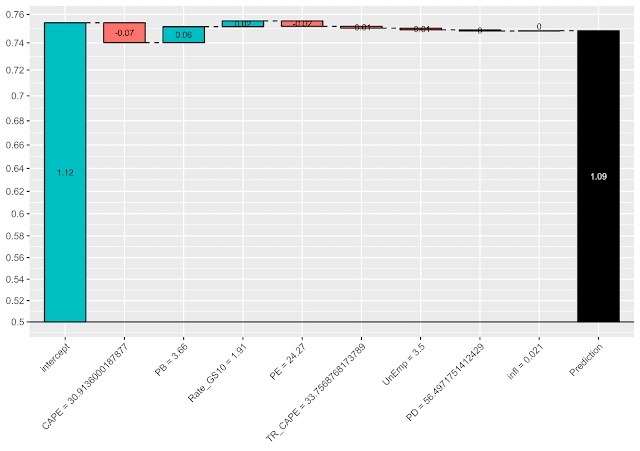
Making accurate predictions using the vast amount of data produced by the stock markets and the economy itself is difficult. In this post we will examine the performance of five different machine learning models and predict the future ten-year returns ...

Predicting the next decade in the stock market
Making accurate predictions using the vast amount of data produced by the stock markets and the economy itself is difficult. In this post we will examine the performance of five different machine learning models and predict the future ten-year returns for the S&P 500 using state of the art libraries ...

von Bertalanffy Growth Plots I
Introduction
library(FSAdata) # for data
library(FSA) # for vbFuns(), vbStarts(), confint.bootCase()
library(car) # for Boot()
library(dplyr) # for filter(), mutate()
library(ggplot2)I am continuing to learn ggplot2 for elegant graphics. I often make a plot to illustrate the fit of a von Bertalanffy growth function to data. In ... [Read more...]
Quantitative Analytics: Optimal Portfolio Allocation
Introduction:
The literature in portfolio optimisation has been around for decades. In this post I cover a number of traditional portfolio optimisation models. The general aim is to select a portfolio of assets out of a set of all possible portfolios being considered with a defined objective function.
The data:
...

Advent of Code, the second half
So Advent of Code 2019 ended last week, and I got all 50 stars. The challenges became considerably more challenging compared to the first half, but base R did allow acceptably efficient solutions in almost all cases. My code is still on GitHub - here’s what I learned about R by ... [Read more...]
Modeling salary and gender in the tech industry
One of the biggest projects I have worked on over the past several years is the Stack Overflow Developer Survey, and one of the most unique aspects of this survey is the extensive salary data that is collected. This salary data is used to power the Stack Overflow Salary Calculator, ...

RStudio Blogs 2019
If you are lucky enough to have some extra time for discretionary reading during the holiday season, you may find it interesting (and rewarding) to sample some of the nearly two hundred posts written across the various RStudio blogs.
R Views
R Views, our blog devoted to the R Community ... [Read more...]
Introduction to Data Science in R, Free for 3 days
To celebrate the new year and the recent release of Practical Data Science with R 2nd Edition, we are offering a free coupon for our video course “Introduction to Data Science.” The following URL and code should get you permanent free access to the video course, if used between now ... [Read more...]
mapply and Map in R
An older post on this blog talked about several alternative base apply functions. This post will talk about how to apply a function across multiple vectors or lists with Map and mapply in R. These functions are generalizations of sapply and lapply, which allow you to more easily loop over ...

Data types in R
What data types exist in R?
Numeric
Integer
Character
Factor
Logical
This article presents the different data types in R. To learn about the different variable types from a statistical point of view, read “Variable types and examples”.
What da...

Data types in R
What data types exist in R?
Numeric
Integer
Character
Logical
This article presents the different data types in R. To learn about the different variable types from a statistical point of view, read “Variable types and examples”.
What data types exist in R?
There are five data types in R:
... [Read more...]
Can Genealogical data be tidy?
Happy families are all alike; every unhappy family is unhappy in its own way — Leo Tolstoy
Like families, tidy datasets are all alike but every messy dataset is messy in its own way — Hadley Wickham
In this post, I’ll be exploring how genealo... [Read more...]
Reliability chapter of ‘evidence-based software engineering’ updated
The Reliability chapter of my evidence-based software engineering book has been updated (draft pdf). Unlike the earlier chapters, there were no major changes to the initial version from over 18-months ago; we just don’t know much about software reliability, and there is not much public data. There are lots ... [Read more...]
Using GitHub actions with R: Some notes from our #TidyTuesday setup
Beginning in September 2019 we started organizing a #TidyTuesday event at the hacklab in Skopje - KIKA. It has been 15 events in 2019, and it’s been great. One of the things we wanted to do from the outset was to have an online repository of all the code and presentations. Both ... [Read more...]
Quantitative Trading Strategies using quantmod
Strategies
Introduction:
Note: This post is unfinished.
This post goes through a number of the technical trading functions in the TTR package here. I add definitions and show examples of how the functions work.
library(dplyr)
library(quantmod)
library(tidyquant)
library(TTR)
library(timetk)
library(tidyr)
library(ggplot2)
library(directlabels)
library(data.table)
library(quantstrat)
library(purrr)
library(quantstrat)
We can download some data using the quantmod package which stores the different assets into ...

Copyright © 2022 | MH Corporate basic by MH Themes