
IRIS Flower Data Set (R-002)
[This article was first published on NIR-Quimiometría, and kindly contributed to R-bloggers]. (You can report issue about the content on this page here)
Want to share your content on R-bloggers? click here if you have a blog, or here if you don't.
Want to share your content on R-bloggers? click here if you have a blog, or here if you don't.
Ver primero: IRIS Flower Data Set (R-001)
See first: IRIS Flower Data Set (R-001)

El comando “summary” nos ayuda a comprender la importancia de cada componente principal:

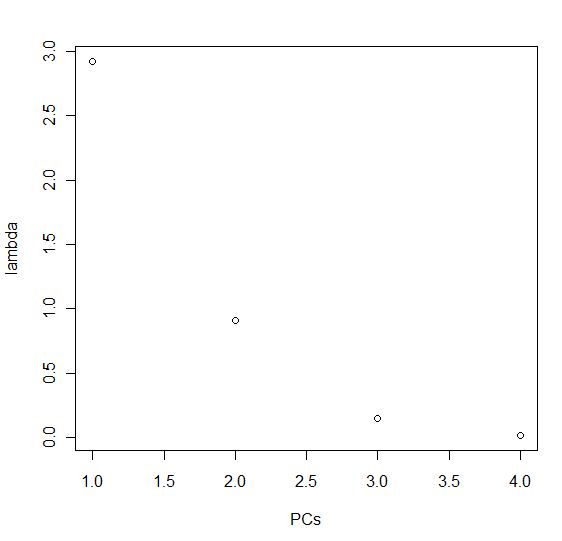
Los “eigenvalues” son las desviaciones estándar al cuadrado:
Para comprobar la importancia de los eigenvalues, podemos verlos en forma de gráfico:
> lambda<-eigenvalues
> PCs<-c(1,2,3,4)
> plot(PCs,lambda)
save.image(“H:\\BLOG\\Curso básico Quimiometria\\IRIS\\parte2.RData”)
To leave a comment for the author, please follow the link and comment on their blog: NIR-Quimiometría.
R-bloggers.com offers daily e-mail updates about R news and tutorials about learning R and many other topics. Click here if you're looking to post or find an R/data-science job.
Want to share your content on R-bloggers? click here if you have a blog, or here if you don't.